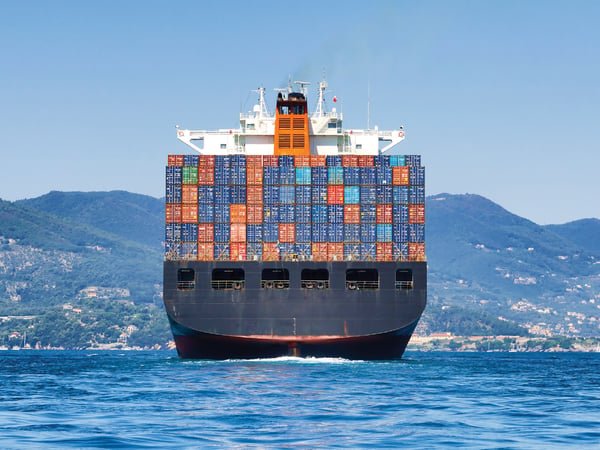
Trans-Pacific and Asia-Europe ocean freight spot rates have climbed sharply since the start of Q2 2026, with major trade lanes recording increases of 40 to 65 percent above January baselines. The acceleration comes earlier than the typical pre-holiday peak season and is catching many importers off guard.
If you're shipping goods from Asia to North America or Europe, the market environment right now demands attention. Here's a breakdown of what's driving rates, which lanes are most affected, and what shippers can do to manage the impact.
What's Driving the Surge?
Several converging factors are pushing rates higher simultaneously — a dynamic that markets haven't seen to this degree since 2021.
1. Carrier Blank Sailing Coordination
The major ocean carrier alliances have coordinated significant blank sailing programs — removing vessel capacity from Asia-North America and Asia-Europe services. This reduction in available space is the most direct lever in the rate equation, and carriers have been disciplined in executing it.
2. Front-Loading Ahead of Tariff Changes
Importers are accelerating shipments to beat anticipated tariff increases on goods sourced from several Asian manufacturing hubs. This pull-forward effect compresses months of normal volume into a shorter window, overwhelming capacity that might otherwise be adequate.
3. Red Sea Disruption Tail Effects
While the acute disruption to Red Sea transit routes has moderated from 2024 peaks, vessels rerouting via the Cape of Good Hope continue to absorb vessel time and equipment. Effective capacity remains roughly 10 to 15 percent below pre-disruption levels on Europe trades.
"We're seeing Q3 and even early Q4 volume moving in late Q2. Importers who haven't secured contracts are now competing for space at spot rates that reflect genuine scarcity — not panic."
Rate Snapshot by Trade Lane
| Trade Lane | Jan 2026 Avg | June 2026 Avg | Change |
|---|---|---|---|
| Shanghai → Los Angeles (40') | $2,100 | $3,450 | +64% |
| Shanghai → New York (40') | $2,750 | $4,200 | +53% |
| Shanghai → Rotterdam (40') | $3,100 | $5,100 | +65% |
| Hong Kong → Los Angeles (40') | $2,300 | $3,700 | +61% |
| Vietnam → Long Beach (40') | $2,000 | $2,800 | +40% |
Spot rate averages; actual rates vary by carrier, commodity, and booking timing. Contact GeoLogistic for current rate guidance.
What Shippers Should Do Now
- Book early and lock where possible. If you have volume visibility for Q3, book now. Rates rarely fall sharply in an advancing market until new capacity enters.
- Evaluate LCL vs. FCL tradeoffs. For smaller volumes, consolidation services can sometimes outperform FCL spot rates in tight markets.
- Review your contract structure. If you're 100% on spot, consider whether a volume commitment arrangement offers better protection.
- Plan for longer lead times. Port congestion at key US West Coast and East Coast gateways is increasing — add 3 to 5 days to transit estimates for planning purposes.
- Explore air freight for high-value, time-sensitive cargo. The cost premium over ocean narrows significantly when you factor in inventory carrying costs and late-delivery risk.
GeoLogistic Can Help
GeoLogistic has established relationships with carriers across all major trade lanes and can access capacity that's unavailable to many shippers trying to book direct. Our team is actively managing rate exposure for clients across several verticals — contact us to discuss your Q3 ocean freight needs.